

PROLOGUE:™ A SEE-AHEAD MATHEMATICAL MODEL FOR FINANCIAL COACHING
INTRODUCTION
Shakespeare wrote “What’s past is prologue” to signify that what has happened sets the stage for what will happen next. What is true in drama is also true in finance. Prologue:™ A See Ahead Model is a coaching tool incorporated into the SmarterAllocations® app to help users learn the habit of actively manage their financial portfolio. It is a mathematical model used to identify past, historic stock market trends and prompt users to take action by contacting their broker or financial advisor for more information. They are learning the habit of taking action.
A mathematical model is a widely used research and development tool providing a simplified representation of a real-world system using mathematical equations and variables. It is a way to describe and understand complex situations by translating them into a quantifiable form, enabling analysis and prediction. Let’s begin with my personal experience using this powerful tool.
I began my graduate study of social psychology equipped with sound quantitative skills acquired at Baltimore Polytechnic Institute. I understood the basics of of mathematical modelling and decided to use the technique to explore Sigmund Freud’s theory of personality development, particularly his concept of identification. Identification is the process where individuals internalize characteristics or traits of another person and incorporate them into their own personality. This internalization can lead to adopting similar behaviors, values, or even becoming like the person they identify with. It’s a generalizable phenomenon. An adult can identify with an athlete, celebrity, political figure or even a social movement. However, Freud focused on identification with parents, emphasizing in his book The Ego and the Id (1923) that “the first identifications in earliest childhood will be profound and lasting.”
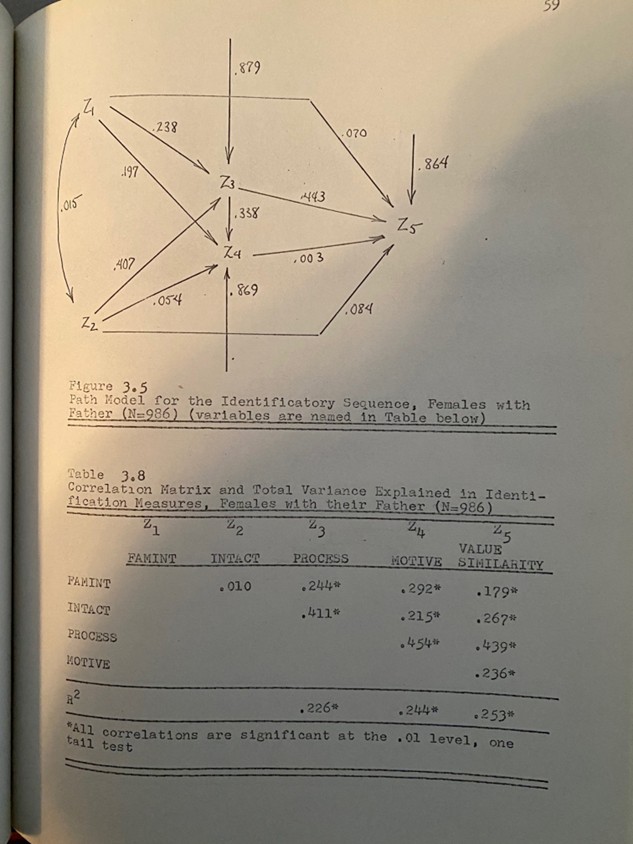
Freud presented his theories more than a century ago as discussions spanning multiple books and essays, making it difficult to measure the variables in a scientifically useful way. For my PhD dissertation I tackled this important problem. I used data from a longitudinal survey of 1200 high school students and chose multi-variate regression analysis as a mathematical modelling approach to test key elements of Freud’s development theory. My dissertation concluded that that the child’s perception of a parent’s nurturance and power are the key forces. In other words, other people influence us because we perceive them as powerful or caring or both. How did I establish that scientifically?
Multi-variate regression applies Pearson’s product moment correlation to an entire system of variables. The coefficient of determination R2 (“R squared”) measures the proportion of variance in the dependent variable that’s explained by all the independent variables in the model. R2 is calculated by a lengthy series of equations using matrix algebra to define the regression model. Multiple regression R2 values range from 0 to 1 (0% to 100% of the variance explained). A higher R2 means the model explains more of the variation in the dependent variable. I tested my model under each type of parent-child relationship (female with mother, female with father, male with mother, male with father). The highest R2 =.26 was for female children identifying with their father, where my model was able to explain about a quarter of the variance, an acceptable result for basic social science. It would not be acceptable for financial prediction models, as will be discussed.
At my dissertation defense, a professor asked, “How could you explain more variance?” The gist of my answer was, “Sigmund Freud would argue that the model needs data on specific events in a child’s life that a survey can’t measure. He would be correct, but we can’t afford to psychoanalyze a thousand kids.” The professors smiled knowingly at my understated dig on the expensive and time-consuming method the great Sigmund Freud made famous. Soon, after almost two hours of equations and graphs, one of them said something like “good answers, solid research.“ My advisor took the cue, declared my presentation a success, and closed the meeting. Ironically, that brief exchange has implications for predicting stock market fluctuation, a modelling problem I am working on many years later.
I began with this example for three reasons. First, to illustrate the breadth of situations where mathematical models can be used; second, to establish R2 =.26 as an example of predictive power; third and most important, to emphasize that the power of your model can be increased when specific events are included as variables. All true, yet when I pulled my richly bound but almost never opened dissertation off the shelf to take this photo of the hand-drawn model, I had an eerie feeling, thinking, “Wow, can it really be true that I am actually using this now?S™
THE SeeAhead™ MODEL
The modelling challenge my team and I are tackling now is this: How can we help PerfectCoaches users acquire the habit of actively managing their retirement investment portfolio? PerfectCoaches is an app based on my patent (US patent 10,249,212) for habit formation. Any habit can be learned using the app, plus the app identifies 45 habits that are particularly useful. They are divided into five skills: the life skills of Personal Excellence, Healthy Living, and Smart Money; and the business skills of Leadership and Customer Service. Each skill consists of specific habits.
- The Planning habit says curb discretionary spending to save 20% of your income (the 50-30-20 rule) so you can take advantage of the fact that wealth doesn’t add up year after year, it multiplies (the rule of 72)
- The Daily Learning habit says learn at least one thing new about stocks, bonds, or real estate investing every day
- The Active Investment Management habit says don’t let your money sit; habits are shaped by cues in the environment, and the cues for this habit are text and email alerts prompting users to consider adjustments to their portfolio
- The Avoid the Debt-trap habit consists of specific steps to get out of debt and, better yet, avoid falling into debt to begin with
- The Think Retirement habit says plan on using only part of your retirement funds each year (the 4% rule) to avoid running out of money
Although the Active Investment Management habit is just one of forty-five covered in PerfectCoaches, it is perhaps the most tangible in terms of its short-term effects. Thus, SeeAhead is a key tool within the app.
Although time-series data, probabilistic models, Monte Carlo simulations, and other tools are useful for understanding long-term trends in the market, we want two additional ingredients for PerfectCoaches. First, the app is designed to change habits, so we want to give users a cue—in the psychology of learning sense—prompting them to take action. Second, there are many users in many different retirement investment plans, so we want both a generalized cue as well as cues specific to a given user’s plan.
Because market timing requires taking action quickly, the SeeAhead model enables SmartMoney to provide alerts telling the user to consult their broker about asset re-allocation in their retirement investments. Alerts do not advocate specific trades or refer to specific stocks. Rather, alerts are designed to identify extant market movement early in the process and tell the PerfectCoaches user one of three things: growing asset value is trending now; declining asset value is trending now; no major changes are trending now. Growing value means it may be time to buy. Declining value means it may be time to sell. When no changes are trending it is time to hold. We call the model SeeAhead because it is measuring price movement ahead of the time the changes actually impacts the market.
Two things make SeeAhead different. First, unlike the typical financial models discussed in the Cheng paper, SeeAhead does not rely solely on time-series data. Rather, it attempts to quantify the potential impact of historical events (a binary variable) based on an analysis of what happened in the market when those events occurred. This recalls the point I discussed earlier in this blog, namely, that Sigmund Freud wanted to know specifically what happened to the child before he would predict an outcome.
The second thing that sets this apart is that. although its can see trends in the entire market, its greatest precision is measuring trends within one particular retirement plan. The basic mathematics is always the same, but the alerts can differ based on the structure of any particular retirement plan. Like the multi-variate regression technique I used in my dissertation, the mathematics modelling technique is basically a constant but the particular calculations vary on a case-by-case basis.
- It is based on calculations for each specific retirement fund.
- It uses a VIX (market volatility) value based primarily on S&P 500 data.
- It is a historic trend analysis of the movement of stocks and ETFS grouped by asset classes, typically large cap, mid cap, small cap, and international.
- Data is updated each day.
- The tables are constructed in an SQL database.
- The calculations are complex and involve pair-wise comparisons of assets and asset classes.
- The goal, as in most financial models, is a very high level of measurable predictability.
SmartMoney and SmarterAllocations, the stand-alone spin-off of the PerfectCoaches app, were designed to be a source of information to help users learn the habit of actively managing their wealth. The alerts are not intended to be, nor should they be used, as financial advice. Alerts simply encourage users to seek advice from qualified brokers and financial advisors. For that reason, brokers and other financial advisors can serve as coaches within the PerfectCoaches business model (see the Join Now page of the OurClub.tech website for a description of the Facilitator Coach role). The broker-coach doesn’t have to do anything except offer our app to their clients. Our existing business model creates the process enabling clients to contact their advisor when they receive alerts.
This use of the PerfectCoaches app has advantages for brokers and advisors. For fiduciary brokers compensated based on the size of a client’s portfolio, it can help increase a client’s wealth by improved market timing and just generally interacting with their broker more often. The potential benefit for brokers compensated on a transaction by transaction basis is that alerts can increase the volume of client-broker communications and resultant trades.
The key to it all is the irony that you can see ahead by looking back–if that is done within the rigor of a mathematical model. Indeed, Prologue, the name for our see-ahead model, comes from an oft-quoted line in Shakespeare’s play The Tempest, “What’s past is prologue,” meaning that events of the past set the stage for the future. Less well know is the entire quote: “And by that destiny to perform an act Whereof what’s past is prologue; what to come, In yours and my discharge.” In other words, it is up to us to take action. Our method proves that the past is prologue not just in Shakespearean drama, but also in the world of finance.
Thanks, Dr. Douglas Hines

Sorry, the comment form is closed at this time.